
In financial markets, prices don’t just move in a straight line—they oscillate around an equilibrium. This concept is known as mean reversion. At its core, mean reversion suggests that prices and other financial metrics tend to gravitate toward an average over time. When an asset price drifts too far from this average, market forces often work to pull it back in the opposite direction.
This behavior can be observed across various timeframes, from short-term price fluctuations to long-term market cycles. Traders and investors use mean reversion strategies to capitalize on extreme deviations from the mean, identifying when a security is overbought or oversold. The assumption is that excessive movement in one direction often leads to a correction.
One of the simplest applications of mean reversion is moving averages. A common strategy is to compare the current price of an asset with its moving average. If the price deviates significantly above or below the average, it may indicate a potential reversal. This principle extends beyond price movements—mean reversion applies to many financial metrics, including volatility, interest rates, and even macroeconomic indicators.
The idea of mean reversion is rooted in the natural ebb and flow of markets. Price does not move in isolation; it reflects the actions of countless buyers and sellers interacting within a system of supply and demand. When an asset price rises significantly above its mean, it often attracts profit-taking, short sellers, or hesitant buyers waiting for a more reasonable entry point. Conversely, when prices fall well below the mean, value investors and contrarians step in, believing the asset is undervalued. These cyclical behaviors create a rhythmic motion in market prices, where price movements stretch and contract like a rubber band.
Applying Mean Reversion to Price Movements
When analyzing individual stock prices, mean reversion can help identify moments of overextension. For example, if a stock is trading well above its historical average price, traders may anticipate a pullback. Conversely, if it trades significantly below its average, it might be due for a rebound.
The effectiveness of mean reversion depends on market conditions. In strongly trending markets, prices may continue moving away from the mean for extended periods. However, in range-bound markets or during periods of price stabilization, mean reversion strategies tend to be highly effective.
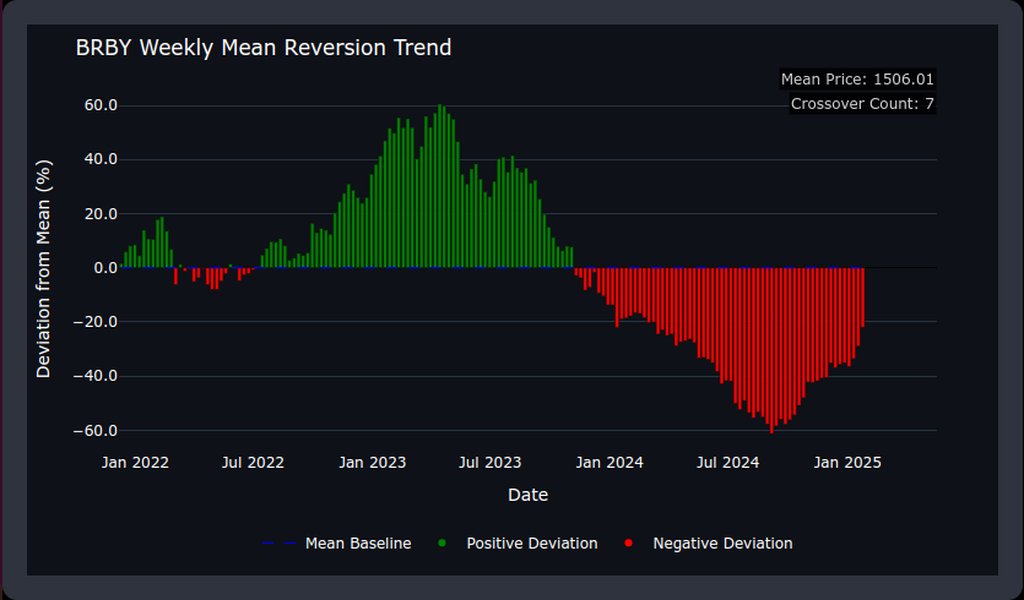
This principle is visible in our Weekly Activity Index, where price deviations from the mean are measured over time. The idea is to capture points where the price is significantly stretched, signaling potential reversion.
Moreover, different asset classes exhibit varying degrees of mean reversion tendencies. Stocks, for example, experience mean reversion but also follow underlying growth trends driven by corporate earnings and economic expansion. Meanwhile, commodities and currencies are often more prone to strict mean reversion behaviors due to supply constraints and macroeconomic policies that keep prices anchored within a range. Understanding the nuances of mean reversion in different markets allows investors and traders to tailor their strategies accordingly.
Volume and Its Role in Market Activity
While price tells us how much an asset is worth, volume tells us how significant a price movement is. Volume represents the number of shares or contracts traded in a given period and provides insight into the strength behind price movements. High volume during a price increase suggests strong buying interest, while high volume during a decline suggests strong selling pressure.
Applying mean reversion to volume allows us to analyze when trading activity is unusually high or low. Just like prices, volume tends to oscillate around an average. Periods of excessive volume can indicate potential trend exhaustion, whereas extremely low volume may signal an impending breakout.
Volume reversion plays a crucial role in market structure analysis. A high volume spike at a peak or trough often signals capitulation—when sellers have exhausted themselves at the bottom or buyers have overextended at the top. Similarly, prolonged periods of low volume may indicate accumulation or distribution phases, where major market participants are quietly building or unwinding positions before the next significant price move.
In our approach, we apply mean reversion to volume data, examining how volume deviates from its historical average. By combining this with price reversion, we gain deeper insight into the overall market activity.

Introducing the Composite Activity Index
With both price and volume deviations measured separately, the next logical step is to combine them into a single, powerful indicator. This is where the Composite Activity Index (CAI) comes into play.
The CAI is designed to capture moments of heightened or diminished activity by incorporating price and volume deviations. Rather than relying on price alone, which can sometimes give misleading signals, we add volume into the equation to confirm market movements. This creates a more robust measure of activity, distinguishing between weak and strong price trends.
A composite index is essentially an aggregation of multiple individual indicators into a single metric that provides a broader perspective on market conditions. In this case, by merging price and volume deviations, the CAI creates a consolidated measure of market activity. This holistic approach ensures that fluctuations are not only identified but also contextualized, preventing misleading signals that might arise from analyzing price or volume in isolation.
Our formula for the CAI assigns equal weight to price and volume deviations. The result is a composite index that fluctuates between positive and negative values, providing a clear visual representation of market cycles. When both price and volume indicate excessive movement in one direction, the CAI reflects this intensity.

Interpreting the Weekly Activity Index Chart
The chart (linked here) showcases the Weekly Activity Index, where the CAI is plotted alongside the stock’s closing price. Positive values (shown in green) indicate periods of heightened bullish activity, where price and volume deviations align in an upward direction. Negative values (shown in red) represent bearish conditions, where both price and volume suggest downward momentum.
Examining the chart, we see how the CAI helps identify turning points. During early 2023, for instance, the index rises sharply, signaling a strong positive trend. This aligns with the price increase, confirming the market’s bullish momentum. Later, as the CAI declines into negative territory, price trends also reverse, indicating a bearish phase.
By integrating price and volume mean reversion, the CAI offers a more comprehensive view of market behavior. Unlike single-metric indicators that can produce false signals, this approach validates price movements with volume trends, increasing reliability.
Final Thoughts
The CAI represents an evolution in market analysis, leveraging mean reversion principles across price and volume. By understanding how these two metrics interact, we gain deeper insights into market trends and turning points. The Weekly Activity Index chart demonstrates the power of this approach, showcasing how price and volume deviations merge into a cohesive analytical tool.
With financial markets becoming increasingly complex, having an indicator that integrates multiple dimensions of activity is invaluable. The Sharemaestro Composite Activity Index does just that—offering clarity in a world of market noise, refining mean reversion strategies, and providing a roadmap for navigating price cycles.


